|
|||
|
|
||||||||||||||||||||||||||||||||||||||||||||||||||||
 |
||||||||
|
Measurements of axial pressure distribution in a lab-scale High Compression Roller Mill / Institute for Mineral Processing of the TU Clausthal (Germany, 1989) |
||||||||
|
Both phenomena cause locally a reduced material flow through the narrowest gap between the rollers in direction of the roller edges. On the other hand the gap width is constant along the whole roller length what leads to a lower compression at the roller edges and a corresponding lower pressure creation. Which of the effects prevails depends on material properties and the particle size of the feed material. The distance between the side walls and the rollers is 0.5 mm. Therefore the loss of material at the roller edges can be neglected, for the fine fraction as well as for the medium size fraction because only a small amount of material could excape in the worst case. Additionally, if the gap at the side walls would have an impact, a particle-size depending pressure distribution should be given what is not the case. So the the loss of material transport due to friction between material and side walls prevails. The width of this edge zone is dependent on the distance at which this waal effect has still an impact. With the previously described construction so called stripe tests were performed for both quartz fractions 1.0/2.0 mm and 4.0/6.0 mm with smooth and corrugated rollers (profile B). During these tests the material is separated and collected in stripes of the same width, in order to determine the throughput and particle size distribution in these three areas which are defned as foloows: inner area: -0.17 Ōēż l Ōēż +0.17 semi-outer area: -0.34 Ōēż l < -0.17 and +0.17 < l Ōēż +0.34 outer area: -0.50 Ōēż l < -0.34 and +0.34 < l Ōēż +0.50 In the first of the two linked tables the corresponding throughput values and solid volume portions are listed for such tests with smooth rollers and with profile B. For the smooth rollers the specific throughput in the outer area is up to 16 % lower and as a result of this the solid volume portion at the narrowest gap is also up to 15 % lower than in the inner and semi-outer area. For the corrugated rollers the biggest measured decreases were 17 % in throughput and 14 % in solid volume portion.
|
||||||||
 |
||||||||
|
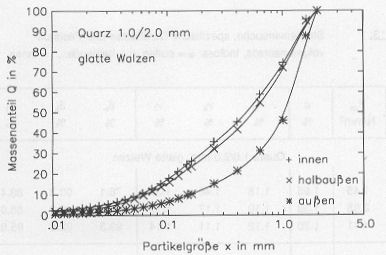
Products of stripe test quartz 1.0/2.0 mm, u = 0.3 m/s, smooth rollers, Fsp = 2.9 N/mm2, stripes: + inner x semi-outer *outer |
||||||||
 |
||||||||
|
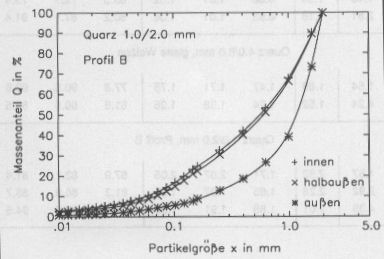
Products of stripe test quartz 1.0/2.0 mm, u = 0.3 m/s, profile B, Fsp = 2.9 N/mm2, stripes: + inner x semi-outer *outer |
||||||||
|
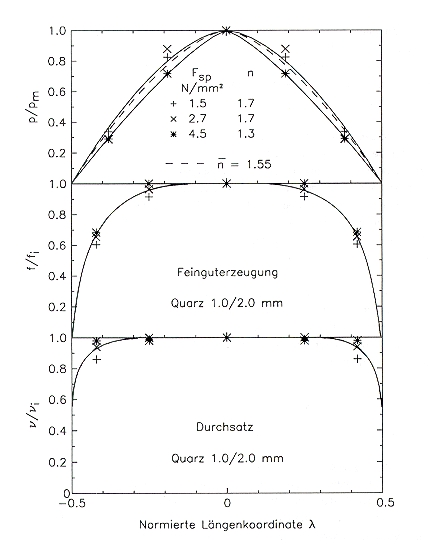
The particle size distributions of the different stripes are shown in the two following diagrams. It can be seen that in analogy to the compression the distributions in the inner areas are very similar while in the outer zones a much coarser product is produced. This effect is observed for all tested particle size fractions, speeds and grinding forces. The axial pressure distribution can be shown in a normalized form pm(l)/pm(l = 0), in the following named p/pm. The diagram below shows such normalized pressure profiles for the middle fraction where the measured values for quartz and limestone were put together in one curve. The normalized curves are very close to each other. Although there is a tendency that a higher grinding force is creating a slightly steeper profile this tendency is statistically not significant. An approximation of the measured values by a parabel opened downwards seems to be reasonable: p/pm = 1 - (2 ├║ l├║ )n -0.5 Ōēż l Ōēż +0.5 For the pressure distribution shown in the diagram (upper curve) the average value of the adjustment variable at minimized square deviation is n = 1.55. The integration of the axial pressure distribution in the different areas delivers the average values for the relative stripe pressure as shown in the second of the two linked tables. The average pressure over the whole roller width is called peff and results as: p/pm = 1 - [1 / (n+1)] The following diagram also shows the normalized throughput and the normalized production of fines from the stripe tests for the medium quartz fraction 1.0/2.0 mm and smooth rollers over the normalized axial coordinate l. Surprisingly these profiles are much more flat than for the pressure. In the outer area the throughput reduces at 1.5 N/mm2 by 14 %, at 2.7 N/mm2 by 6 % and at 4.5 N/mm2 by 2%.The hypothesis that the steep pressure decrease at the sides is caused by reduced material flow is therefore questionable. To clarify this issue additional press tests in cylinder press were performed and the compression at pressures of 40 and 80 MPa was measured. The material bed height in these tests was 5.4 respectively 5.0 mm and therefore equivalent to the gap width at the beginning of the compression zone between the rollers. |
||||||||
 |
||||||||
|
Normalized axial pressure distribution, normalized production of fines < 1mm and normalized specific throughput, medium fraction, u = 0.3 m/s, Fsp = + 1.5, x 2.7, *4.5 N/mm2 / Institute for Mineral Processing of the TU Clausthal (Germany, 1989) |
||||||||
|
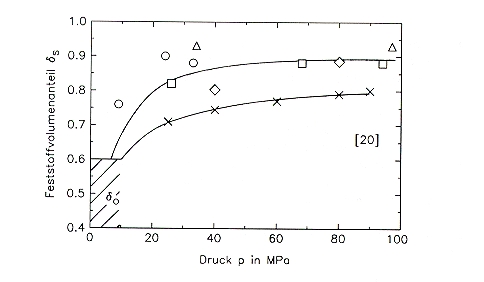
In the diagram below the solid volume portion deltaS is shown for 40 and 80 MPa. Additionally the results of the stripe tests are included and shown at the corresponding maximum pressure in the stripes. A pressure of 40MPa in the pot of the cylinder press already creates a compression of deltaS = 0.80 which increases to deltaS = 0.88 at 80 MPa. The results of the stripe tests show similar compression values. For the average grinding pressure of 2.7 N/mm2 the compression values match very well the cylinder press tests, for the smaller and bigger grinding force they are even above. More investigations regarding this problem were not done yet as here it should only be shown that at such high compression values already small variations of the compression are creating high differences in pressure. From this observation follows that a slight decrease in the material flow at the roller edges may create a strong reduction in pressure. For comparison the diagram also shows the values from the doctoral thesis of M├╝ller [20]. The compression values are approximately 10 percentage points lower. The material bed height in those tests was 12 mm which means ŌĆ£ideal material bed situationŌĆØ (material bed height h > 6 xmax). As already known a lower material bed can be more compacted at the same pressure as a higher one; the results shown here are in accordance with this experience. |
||||||||
 |
||||||||
|
Maximum solid volume portion in a cylinder press for material bed situation (MB) according M├╝ller [20] respectively in transition to material bed situation (MB/T) and in the stripe tests in the high compression roller mill (inner, semi-outer and outer area), quartz 1.0/2.0 mm. Press p = pm: # MB/T x MB HCRM p = peff(delta l), Fsp: o 1.5 ^ 2.7 [] 4.5 N/mm2 |
||||||||
|
|
|