|
|
|
|
|
|
Idea
purpose, advantages, inventor
|
|
|
|
|
Research
comminution, material throughput, pressure distribution, modelling
|
|
|
|
|
Praxis
plant configuration, roller wear, references
|
|
|
|
|
|
|
|
Other Links
links to suppliers, universities and other institutions
|
|
|
|
|
Contact
for any questions please contact us
|
|
|
|
|
|
|
|
|
|
|
|
|
Description of the Testing Program
|
|
|
|
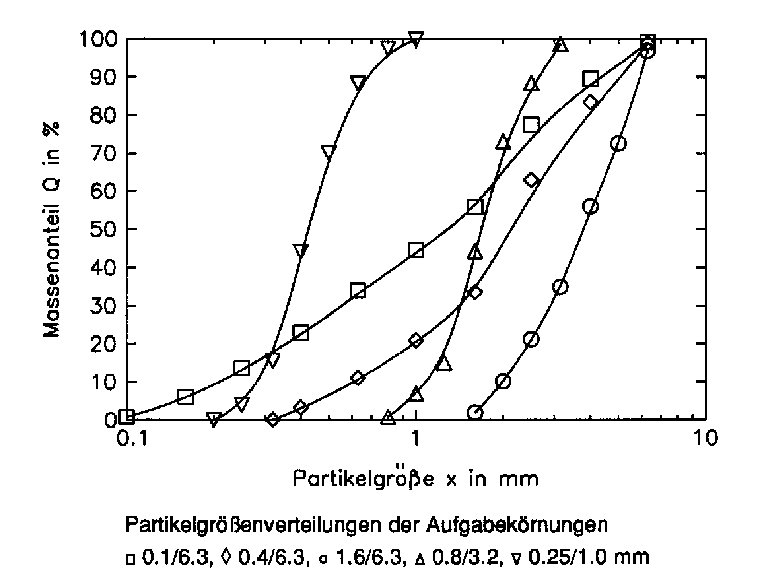
The testing materials as representatives for hard and middle hard materials were quartz with a SiO2-content of 95 % and limestone with a CaCO3-content of 99 %.
The quartz with a density of 2.65 g/cm3, Mohs-hardness 7, stems from the quarry Witterschlick near Bonn (Germany). The limestone with a density of 2.70 g/cm3, Mohs-hardness 4, comes from the quarry Blaustein near Ulm
(Germany).
For both materials the feed grainings were produced by the mixing of narrow particle size fractions.
|
|
|
 |
|
|
Particle Size Distributions of the Feed
Materials / Institute for Mineral Processing of the TU Clausthal (Germany, 1989)
|
|
|
The maximum particle sizes of these grainings are 1.0, 3.2 and 6.3 mm. The relation of minimum to maximum particle size is
appr. 1:4, 1:16 and 1:64. The page Testing Materials contains the bulk and the jog densities of the materials, the particle size distributions are shown above. For high-speed videos, for pressure measurements and for stripe tests purchased R5- and R10-fractions or similar fractions were used. All materials were dry.
The variation range of the specific grinding force Fsp was between 1.0 and 5.0 N/mm2, that of the circumferential speed was between 0.3 and 3.3
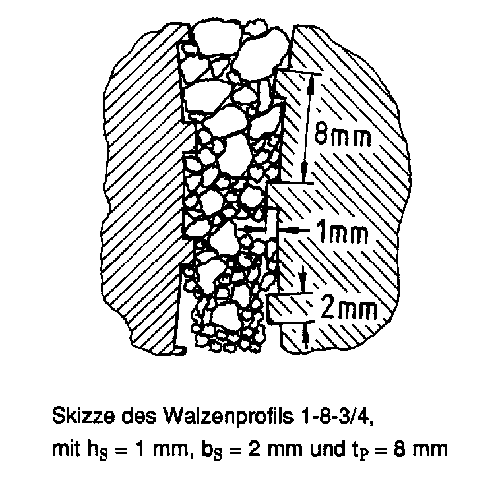
m/s. The surface structur of the rollers was varied by the use of smooth and corrugated roller surfaces, see picture below as well as page Roller Pairs.
The bar profiles which were arranged transverse to the running direction are characterized in the following by the height
of the bar, the profile pitch and the relation of groove width to profile pitch. The size relation of particles and corrugation is shown on below as well as in the chapters with the test results.
|
|
|
|
|
Comminution
grinding results for different materials
Exper. Setup
lab-scale mill, techn. data mill, intrumentation, feed materials, testing program, roller surface data, test execution
Throughput
literature, decoupling of throughput and comminution, energy absorption, characteristic of different rollers, phenomenons, throughput results, elasticity, friction angle, specific throughput
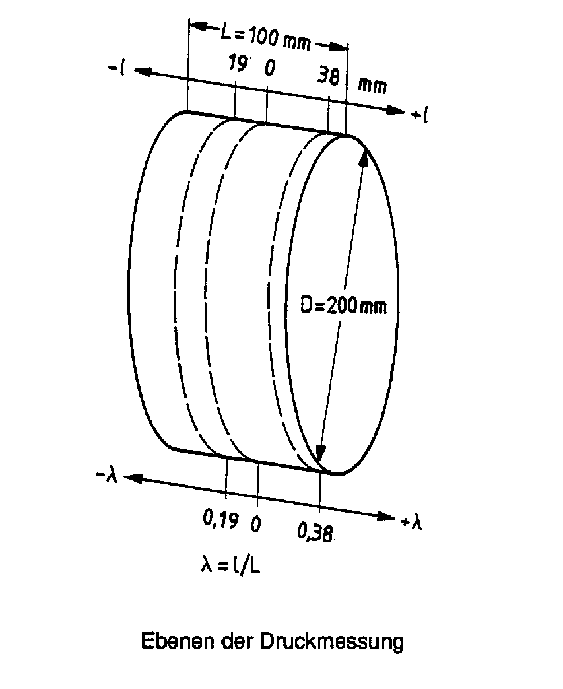
Pressure Distribution
pressure diagrams
Press Tests
tests with a molding press
Modelling
mathematic model of the process
Signs and Symbols
nomenclature
|
|
|