|
|||
|
|
||||||||||||||||||||||||||||||||||||||||||||||||||||||||||||
 |
|||
|
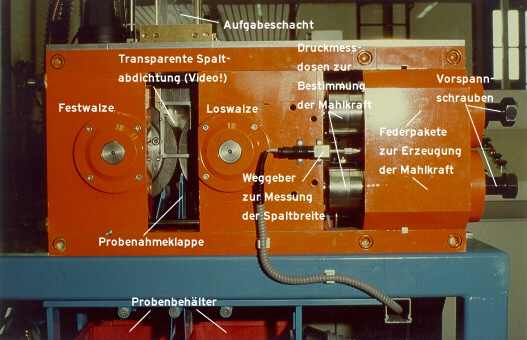
Principle Sketch of the Lab-scale High Compression Roller Mill / Institute for Mineral Processing of the TU Clausthal (Germany, 1989) |
|||
|
The mill is supplied with material through a rectangular funnel. A fill level control, consisting of a vibration-chute and a capacitive sensor, assures a continuous material column between 500 to 550 mm above the shaft plane. Two walls of the funnel which are extended below the shaft plane work as a sealing of the gap and prevent the material from leaking on the side of the gap. The slit between the funnel wall and the front surface of the roller is 0.5 mm. For observation purposes a window out of hardened glass can be inserted into the funnel side wall. The comminuted material is collected in two drawers beneath the mill (see photo above).One drawer is used for sample taking under stationary conditions whereas the other box is collecting the forerun and the tailings. For sample taking a flap which is extended into the gap area between the two rollers is reversed pneumatically. Start and end point of the sampling procedure are registered. During some tests - concerning the axial pressure distribution - the grinding product was collected in stripes, see picture below. For this purpose a sampling box with chambers was mounted underneath the rollers.The chamber walls divide the working length of the roller into stripes of 16.7/16.7/33.3/16.7/16.7 mm. After the test the product fractions are weighed and analysed separately. |
|||
 |
|||
|
Principle Sketch of the collecting box for stripe tests: a = 16 mm, h = 16 mm, i = 32 mm, seperating plates = 1 mm / Institute for Mineral Processing of the TU Clausthal (Germany, 1989) |
|||
|
The drive of the mill is shown in the following illustration. A DC-shunt-motor below the drive chain (not shown in the picture) is driving the two power trains via tooth belt (1), electro-magnetic coupling (2) and furcation gear (3). Both power trains are equipped with a torque measurement shaft (4) and an offset-adjusting coupling (5). Additionally on the power train of the fixed roller there is a slip ring system (8) for transmitting the signals from the pressure sensor inside the roller and from the rotation angle measurement (9). The motor speed frequency is adjustable. The recalculated signal of the tacho sensor of the motor is shown as the roller speed frequency on the control panel. All important technical specifications are shown in Table 1. The signals from the torque measurements (4), from the load cells (6), from the displacement sensors (7) and from the tacho sensor of the motor are amplified, added or averaged and intermediately stored on a transient recorder. Start and end point of the sampling are marked by DC-tag. The recorded signals are analysed on the cable connected computer system. Thereby only the sampling interval is taken into consideration. The measured torque is corrected with the related idle running torque. The sensors in use and the devices for the signal processing are shown in Table 2. |
|||
 |
|||
|
Drive Chain of the High Compression Roller Mill / Institute for Mineral Processing of the TU Clausthal (Germany, 1989) |
|||
|
The observation of the particle movement in the funnel is performed with a high speed video camera (Ektapro 1000 / Kodak). The sequencies with 1000 images per second can be replayed as fixed-images or as slow-motion with 1 to 30 images per second. The analysis of a video sequence provides information about the coordinates of the particles and the appropiate point of time. So particle track, velocity and acceleration can be calculated. For the measurement of the pressure distribution in the gap of the rollers miniaturised pressure sensors are used, see picture below. The pressure pin at the top of the sensor, on which the material bed is pressing, has a diameter of 2 mm. In the middle section the sensor has a rectangular profile with a cylindrical inner hole. On two opposite faces of the sensor crosswise strain gages are applied as a full bridge system. For easier adjustment and calibration and for better protection against external impacts the sensors are put in a mounting, consisting of a base plate and a cover plate. After the roller assembly the cover plate is on par with the roller surface. |
|||
 |
|||
|
Load cell for pressure distribution measurements (load cell is mounted inside the roller and used as a pressure sensor). |
|||
|
Through holes in the shaft the measuring lines are lead to the slip ring system on the power train where the signals are taken off from the rotating system. The amplifying is done with a DC-amplifier. The pressure signal and the signal of the potentiometric rotation angle measurement are stored on the transient recorder, see Table 2. In the following picture a flow chart of the complete instrumentation is shown as a schematic. |
|||
 |
|||
|
Flow chart of the measuring devices. |
|||
|
|
|